Park Factor in MLB Betting: How Ballparks Reshape Markets
Loading...
I watched a 19-13 game at Coors Field on a TV in a London pub one summer evening and saw three different punters around me cursing their over bet – they had backed the over at 11.5 and watched it go through in the fourth inning. The losing positions in the room were on the under side at the same number. The lesson was not that Coors is a hitter’s park. Everyone knows that. The lesson was that knowing a park favours hitters and pricing it correctly are two different things, and most casual punters never close that gap.
Park factor is the most consistently underexploited input in MLB totals betting for UK punters. Books price it well. Punters often ignore it or apply it bluntly. Understanding which parks shape which markets – and how much – is one of the few areas where doing the homework in advance pays off reliably.
What Park Factor Measures
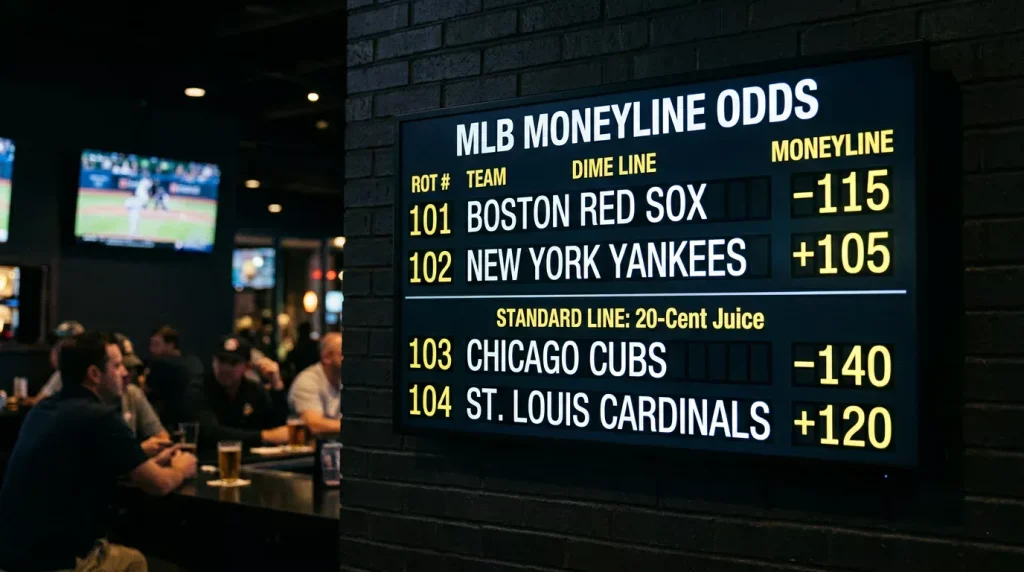
Park factor is a numerical adjustment expressing how much more or less scoring a given ballpark produces compared with the league average. The league average is set at 100. A park factor of 110 means the venue produces 10 per cent more runs than average. A park factor of 90 means 10 per cent fewer.
The number can apply to overall scoring, or it can break down by component – home runs, doubles, walks, strikeouts. A park might have an overall factor of 105 but a home run factor of 120, meaning it inflates power more than it inflates singles and walks. These component factors matter when you are pricing props rather than totals – the article on MLB home run prop betting goes into how to read them for power markets.
Park factors are calculated over multiple seasons because single-season figures are noisy. A park might play 108 in one year and 96 the next purely because of which teams played there and what the weather did. Reliable park factors blend three to five seasons of data to smooth out the noise. The numbers used by major analytics services and most sportsbook pricing models are these multi-season averages, not the current-year figures that get quoted in highlight packages.
The key thing to understand: park factor is already in the price. When a book sets a totals line at Coors Field at 11.5 instead of 8.5, they are pricing the park factor. The bettor’s edge is not in identifying the obvious hitter or pitcher parks – it is in identifying the specific games where the park factor combines with other inputs in ways the market may be miscalculating.
The Hitter-Friendly Group: Coors, Cincinnati and Boston
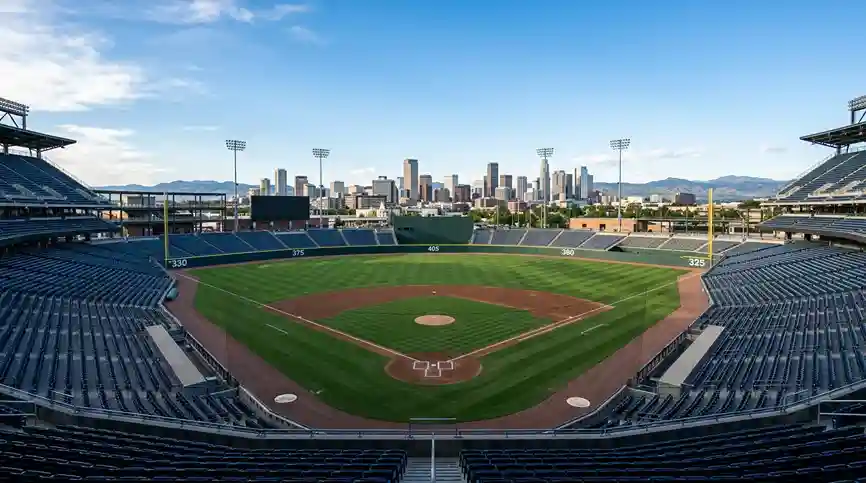
Coors Field is the headline example for hitter-friendly parks, and it is genuinely the outlier among MLB venues. The Denver elevation reduces air density, which means fly balls carry further and curveballs have less bite. Park factors for Coors typically run between 115 and 125 over multi-season averages. Some years it spikes higher. The effect is real and it is large.
What Coors does to a totals line is push it 2 to 3 runs above where the same teams would play elsewhere. Two starters who would produce a totals line of 8.5 at a neutral park play to 11 or 11.5 at Coors. The book accounts for this baseline shift, but punters often underestimate how much it compounds with other factors. A 12 mph wind blowing out at Coors creates a different game than the same wind at, say, Petco Park. The elevation effect amplifies whatever wind or weather is doing.
Great American Ball Park in Cincinnati is a strong but less extreme hitter’s venue. Short fences, particularly to right field, inflate home run totals by 15 to 20 per cent compared with league average. Recent multi-season factors run around 108 to 112 overall. The Reds have built rosters around this profile at various points, leaning into left-handed power.
Fenway Park in Boston is the third in this group, though it operates differently from the other two. The Green Monster turns hits that would be home runs in other parks into long singles or doubles, while also producing easy home runs over a relatively short distance to right field. The net park factor is mildly hitter-friendly – around 103 to 106 – but the distribution of how runs score is unusual. More doubles, fewer home runs, more runners in scoring position. Betting Fenway is partly about expecting the unexpected scoring pattern.
The Pitcher-Friendly Group: Oakland, San Francisco and Marine Layer Cities
On the other side of the spectrum sit parks that suppress run scoring. The mechanics vary – large dimensions, heavy air, foul territory, weather – but the result is consistent. These are venues where totals lines run two or three runs below what the same matchup would produce elsewhere.
Oakland Coliseum, for as long as it was active, was the textbook pitcher’s park. Vast foul territory turned routine pop-ups into outs that would have been souvenirs in other ballparks. Multi-season park factors typically sat between 92 and 96. With the Athletics moving away from Oakland into temporary venues and eventually to Las Vegas, the pitcher-park profile of that franchise is shifting, but the historical impact on totals lines for Oakland home games was meaningful for two decades.
Oracle Park in San Francisco is the marine-layer poster child. The cool, dense, damp air coming off the Bay reduces flyball carry, particularly for evening games. Park factors run around 92 to 95. The right-centre power alley is genuinely hard to clear. Pitchers love it. Power hitters traded away from San Francisco often see immediate jumps in their home run numbers at their new venues.
Petco Park in San Diego sits in similar marine-layer territory, with factors around 94 to 97. Citi Field in New York, T-Mobile Park in Seattle, and to a lesser extent Marlins Park in Miami round out the group of parks that consistently suppress scoring. The common thread is heavy air – coastal, cool, often humid – which works against ball carry.
For totals betting, these parks are where the under often looks too cheap. The market sometimes anchors to recent scoring environment and underweights the structural suppression of marine layer venues. Pairing a strong pitcher matchup with a pitcher-friendly park is one of the more reliable under setups in MLB.
The Humidor Era and How It Quietly Shifted Totals
The humidor is the most interesting recent park-factor story, and it is one that took years to fully filter into market pricing.
Coors Field installed a humidor in 2002 to store baseballs at higher humidity, which makes them slightly heavier and reduces flyball distance. The change was intended to bring Coors closer to league-average scoring without altering dimensions. It worked partially – the park factor dropped from the 130s into the 110s and 120s over the following seasons. Coors became less extreme, but still markedly hitter-friendly.
Other parks have since adopted humidors. Chase Field in Arizona installed one in 2018, which converted that venue from a strong hitter’s park into a neutral or slightly pitcher-friendly one. Park factors fell from around 105 to roughly 98 within two seasons. T-Mobile Park added one. So did Miller Park in Milwaukee, now American Family Field.
What is interesting about the humidor effect for bettors is the lag. Books adjust their pricing within weeks of a humidor installation, but the totals market in the secondary information environment – the public, the commentary, the casual bettor – lags by months or seasons. There were genuine value spots for unders at Chase Field in 2018 and 2019 where the public still treated it as a hitter’s park while the book had already adjusted.
The current generation of park-factor adjustments includes ball composition itself. MLB tweaked the baseball’s specifications quietly several times during the 2010s, which produced league-wide scoring shifts that effectively re-priced every park’s factor. The bettors who track these meta-changes earlier than the public are operating with information advantages that compound. Total game time has stayed steady at 2:38 in 2025 despite all these changes, suggesting the structural pace of the game holds independent of how the ball plays. The trend matters for totals pricing too – when the ball is juiced, every park’s factor moves upward simultaneously, and the books adjust slower than they should on the venues nobody is talking about.
Park Factor Questions
Two questions come up most often about ballpark effects in MLB betting. The first is about the specific magnitude of the Coors effect on totals. The second is about whether the Chase Field humidor really changed the market in measurable terms – a useful case study for how slowly some structural adjustments propagate into public consciousness.
How much does Coors Field add to a totals line in decimal terms?
Coors typically adds 2 to 3 runs to the totals line compared with the same matchup at a neutral park. Two starters who would produce an 8.5 line in San Francisco would price around 11 to 11.5 at Coors. The exact number depends on the wind, weather, day-night status and the specific pitching matchup, but the baseline 2-to-3-run uplift is consistent. The decimal price on the over and under typically lands near the standard -110 juice once the line is set.
Did the humidor at Chase Field actually change pricing behaviour?
Yes, measurably. Before the 2018 humidor installation, Chase Field had a park factor around 105 to 108. Within two full seasons after installation, that figure dropped to roughly 96 to 99 in multi-season averages. Books adjusted their totals pricing within weeks of the change. Public perception lagged considerably, which created a window where unders at Chase Field were systematically softer in the market than the underlying scoring environment justified.
This material was created by the Mound & Margin team.
Related posts
Home Field Advantage in MLB Betting
One-Run Games and MLB Betting Math