One-Run Games and MLB Betting Math
Loading...
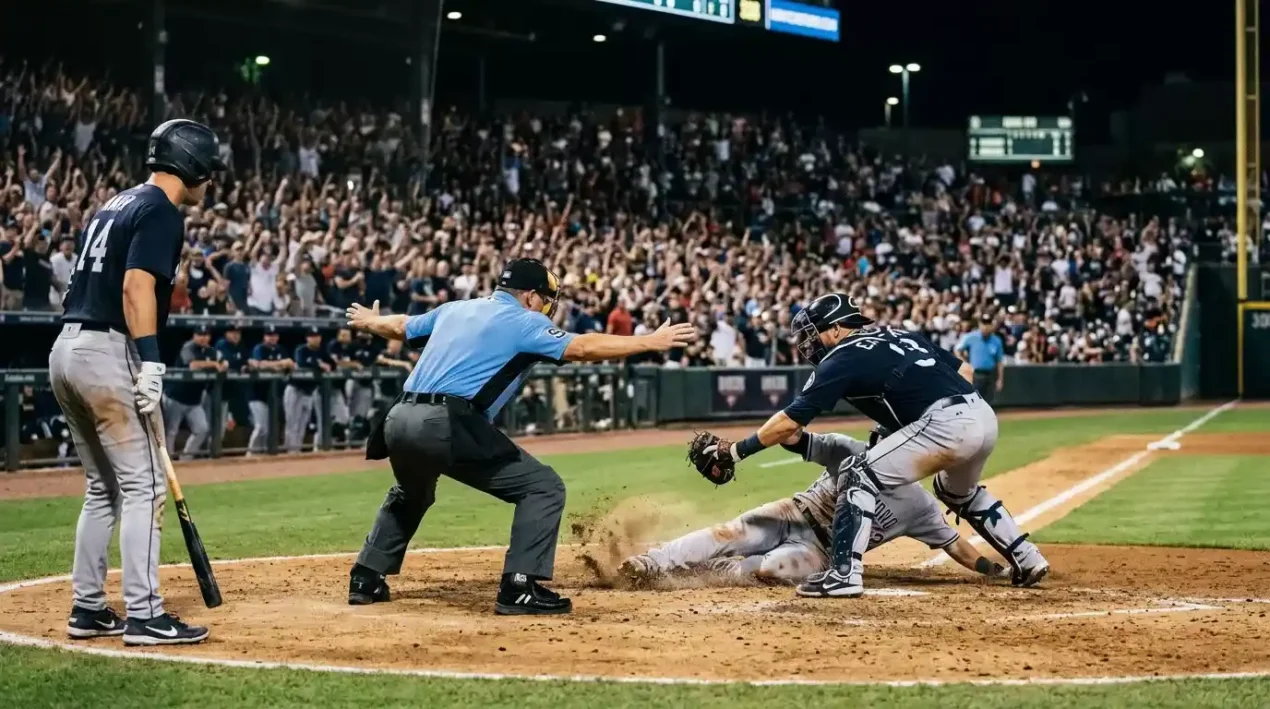
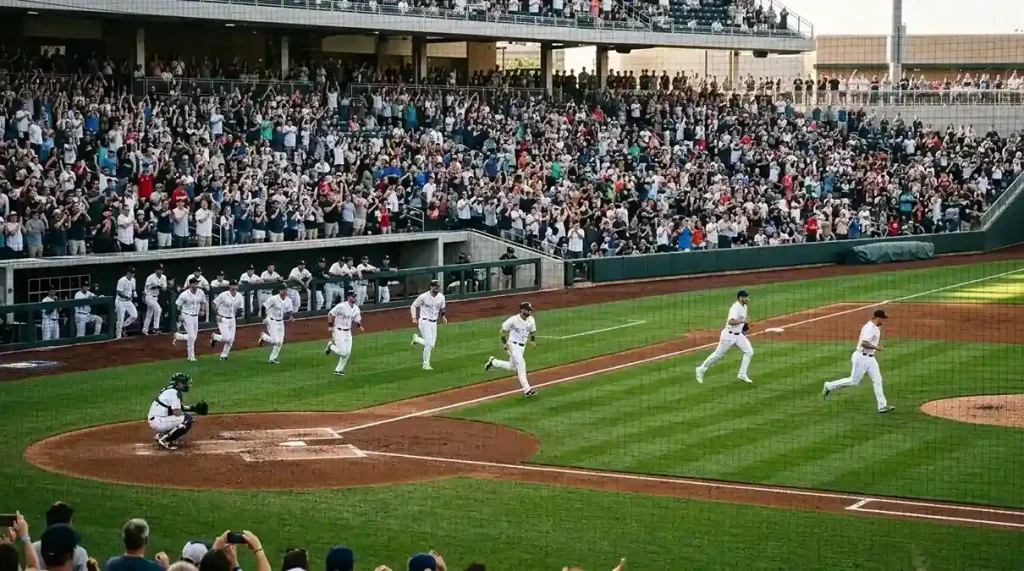
If you sit down and watch MLB for a week, you will be struck by how often games come down to one swing of the bat in the eighth or ninth inning. It is not a coincidence and it is not selection bias. It is structural. Roughly three games out of ten end with the winning team scoring exactly one more run than the losing team, and once you understand why that happens, you start seeing the entire run line market in a different light.
The one-run frequency is the most important single number in baseball betting maths. It explains why the run line is fixed at 1.5, why the alternate ladder prices the way it does, why home and away win rates sit where they do, and why bettors who treat MLB like football routinely misprice their positions. I want to walk through the number, the distribution behind it, and what both mean for the markets you bet.
Why Nearly Three in Ten MLB Games End by One Run
The headline figure is roughly 30 per cent across the modern MLB era. Some analyses put it slightly lower at around 28 per cent, and the exact rate fluctuates year to year between roughly 27 and 31 per cent. Whichever number you use, the fact stands: more MLB games are decided by exactly one run than by any other margin.
The reasons are structural, not accidental. MLB games are low-scoring compared with other major sports – average combined runs per game sit in the high single digits, around 8 to 9. With that baseline, a one-run margin is mathematically far more likely than in basketball, where teams routinely score 100-plus and a one-point margin is statistically rare.
The second structural reason is closer specialisation. Modern bullpens are built around one-inning specialists, particularly the ninth-inning closer who is deployed specifically when his team has a lead of one, two or three runs. That deployment pattern keeps tight games tight – the closer’s job is to preserve a small lead, not to extend a large one. Roughly 65 per cent of saves in modern MLB are recorded in games where the closer enters with a one- or two-run lead. The save rule itself reinforces close games.
The third reason is offensive strategy in late innings. When you trail by a run with one out in the ninth, you do not swing for the fences – you try to get a runner on. When you trail by four, you swing harder and strike out more. The strategic asymmetry between trailing-by-one and trailing-by-many means one-run deficits get closed at a much higher rate than four-run deficits. The result is that more games end by exactly one run than the raw scoring distribution would suggest.
The pitch clock era has not significantly changed this distribution. Games are shorter – 2:38 average in 2025, third straight year at or under 2:40 – but the structural reasons for one-run frequency are about strategy and bullpen design, not game length. The 30 per cent figure has held steady through the pace reforms.
The Full Margin Distribution: One, Two, Three and Beyond
The one-run figure is the start, not the end of the story. Understanding the full margin distribution is what gives you the maths behind the alternate run line ladder and the broader pricing of game outcomes.
A typical season distribution looks something like this, with some year-to-year variation: one-run games at 30 per cent, two-run games at 17 per cent, three-run games at 13 per cent, four-run games at 10 per cent, five-or-more-run games at the remaining 30 per cent. The numbers shift a percentage point here or there, but the shape is consistent.
What is interesting in this distribution is the long tail. While one-run games dominate the conversation, the combined share of games decided by five runs or more is also nearly 30 per cent. The MLB margin distribution is bimodal – clustered at the close end and the blowout end, with relatively fewer games in the two-to-four-run middle.
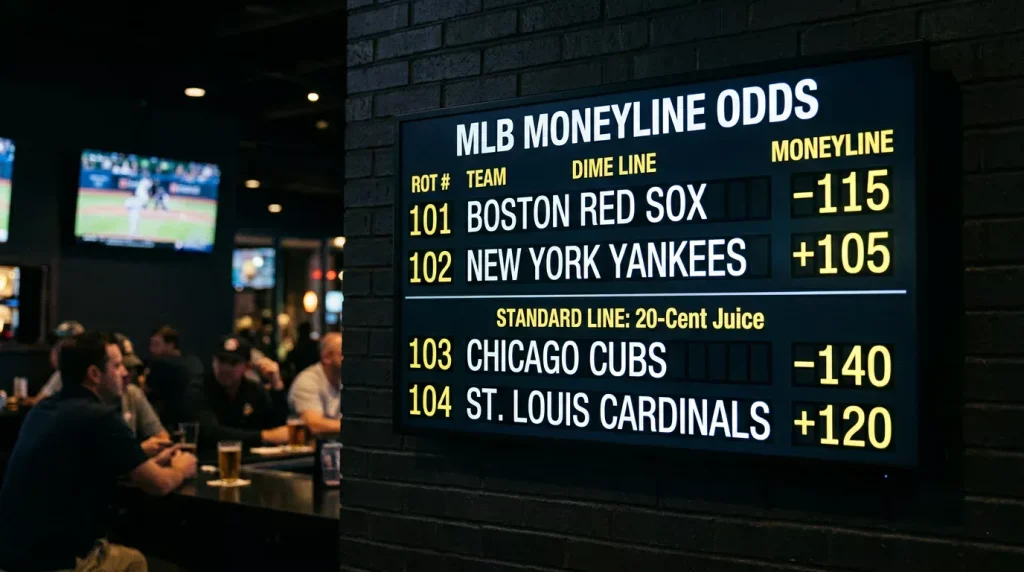
This shape is why the run line is fixed at 1.5 rather than 2.5. A 2.5-run spread would skip over the 17 per cent of two-run games – those would all push to the underdog side at +2.5 – which would create lopsided pricing. The 1.5 spread sits between the most common one-run margin and the second-most common two-run margin, splitting the distribution at a point where roughly 47 per cent of games go to the favourite side (winning by two or more) and 53 per cent to the underdog side (winning, tying or losing by one).
The distribution also explains why alternate run lines stretch the way they do. -2.5 covers winning by three or more, which is roughly 53 per cent of all games when applied to the favourite side specifically. -3.5 covers four-or-more-run margins, which sits closer to 40 per cent. -4.5 covers five-plus, which drops to 30 per cent. Each step removes a meaningful chunk of probability mass.
How That Distribution Shapes Run Line Pricing
The math of the margin distribution is what the book uses to price the run line. Understanding the same math lets you sense-check those prices.
A team that is a 60 per cent moneyline favourite is winning the game outright in 60 per cent of cases. But how often are they winning by two or more? That depends on how their win distribution sits inside the broader margin distribution. A typical heavy favourite who wins 60 per cent of the time also wins by two or more in roughly 38 to 42 per cent of those games – meaning the team wins by exactly one run in 18 to 22 per cent of all matchups.
That number – 18 to 22 per cent of all games – is what the run line -1.5 has to be priced against. If a 60 per cent moneyline favourite wins by two or more in 40 per cent of cases, then -1.5 should price around decimal 2.50 in a no-vig market. The book then adds margin, and the displayed price comes in around 2.20 or 2.30.
The relationship is not always intuitive. Some moneyline favourites are favourites because they consistently win close games – high-leverage bullpen, clutch hitters, low variance offence. Those teams should price -1.5 longer than their moneyline price implies, because they win by one run more often than the typical favourite. Other moneyline favourites are favourites because they routinely win comfortably – deep lineup, dominant starter, weak opposition bullpen. Those teams should price -1.5 shorter than the headline implies, because they cover the run line at a higher rate.
The book has the data to distinguish between these two profiles. The bettor sometimes does not. Recognising which profile a favourite fits is one of the more reliable ways to find value on the run line ladder – particularly the alternate run line steps, which the article on the MLB run line covers in more detail.
Late-Inning Volatility and Why Closing Pitchers Matter
The one-run frequency would not be as high as it is without the structural role of the closer.
Modern closers are deployed almost exclusively in close games. A team with a four-run lead in the ninth rarely brings in their closer – they use a long reliever to soak innings. A team with a one-run lead almost always brings the closer. That deployment pattern means that the highest-pressure innings in MLB are pitched by the most specialised arms, and those arms vary wildly in quality across the league.
A bottom-tier closer who blows save situations at a 25 per cent rate makes his team’s one-run leads less safe than a top-tier closer who blows them at 12 per cent. The 13-point gap shows up directly in the one-run game frequency for that team’s games – they end in walk-off wins or losses more often than league average.
This is why bullpen depth research matters more for MLB than for almost any other sport. A team with three reliable arms in their bullpen – closer plus two solid setup men – protects close games. A team with one good closer and a thin bridge to him gives up leads in the seventh and eighth, creating the volatility that produces walk-offs in either direction. Knowing which teams have which profile is what separates informed MLB bettors from people who just back the names.
One-Run Game Questions
The two questions that come up most about one-run game frequency are about the actual percentage rate and about whether different ballparks change the figure. Both have direct numerical answers from the way MLB scoring distributes.
What proportion of MLB games are decided by exactly one run?
Roughly 30 per cent across the modern MLB era, with some sources putting the figure slightly lower at around 28 per cent. The exact percentage varies year to year between roughly 27 and 31, but the structural factors keeping the rate high – closer specialisation, late-inning strategy, low overall scoring – have remained consistent. The one-run frequency is the highest single-margin share in baseball by a wide margin.
Does the one-run frequency vary by ballpark?
Yes, modestly. High-scoring parks like Coors Field produce slightly fewer one-run games because the higher run totals create more variance in the final margin – when teams score 12 and 8, the chance of a one-run margin is lower than when they score 4 and 3. Pitcher-friendly parks like Oakland tend to produce more one-run games because the lower run environment compresses margins. The variation is real but small – typically two or three percentage points either side of the league average.
This material was created by the Mound & Margin team.
Related posts

Park Factor in MLB Betting: How Ballparks Reshape Markets
Home Field Advantage in MLB Betting