Home Field Advantage in MLB Betting
Loading...
A reader emailed me last spring asking why his Premier League instincts kept misfiring on MLB moneylines. He had a system: back the home team in close matchups. It worked for him on football. It was costing him on baseball. The answer is one of those numbers that takes thirty seconds to explain but reshapes how you bet MLB once you understand it. The home edge in baseball is the smallest in major team sport, and treating it like any other sport’s home edge is a recipe for steady losses.
Home field advantage exists in MLB. It is not a myth. But its size is dramatically different from what you see in football, basketball or American football, and the structural reasons for that difference matter when you are pricing your own positions against the book’s.
The 54 Per Cent Number and What It Means
The headline figure: MLB home teams have won roughly 54 per cent of regular season games over the modern era, since around 2004. In some seasons it has dipped below 53 per cent – 2018 and 2019 were close to the lower bound – and in others it has nudged towards 55 per cent. The long-term centre of gravity sits at 54.
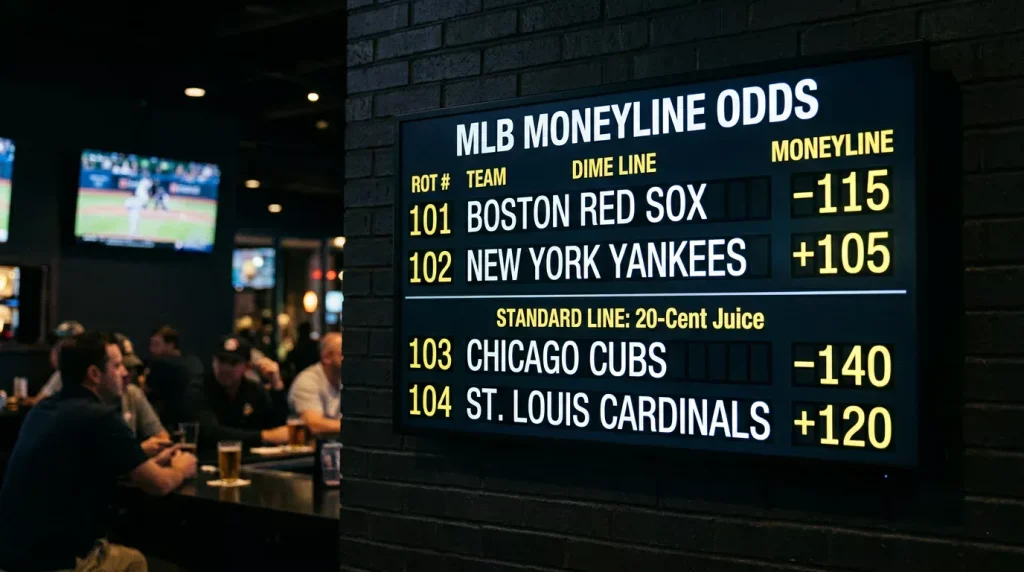
Translate that into betting terms. If a matchup is otherwise even – same pitching, same offence, same bullpen – the home team should be a slight favourite. In a no-vig market, decimal 1.85 for the home side and 2.17 for the away side. Add typical book margin and the home side prices around 1.83 with the away side at 2.10. That is the entire mathematical impact of MLB home edge on a balanced matchup.
The 54 per cent figure has been remarkably stable across rule changes, including the universal designated hitter, the pitch clock and the larger bases introduced in 2023. The pitch clock era has produced average game times of 2:38 in 2025, the third straight year at or under 2:40, but the home win rate has not moved noticeably as a result. Whatever home edge exists in baseball is structural to the sport, not produced by pace of play.
What the number is not: it is not a green light to back home favourites. The 54 per cent is already priced into the market. The book knows it. Every moneyline you see has the home edge baked into the favourite/underdog asymmetry. Backing the home team because they are home, without any other information, returns you essentially zero edge over many bets – the book has charged you exactly the right margin to make it a flat bet at scale.
Why Baseball’s Home Edge Is the Smallest in Major Sport
Compare the 54 per cent home win rate in MLB to other major sports. NFL: roughly 57 per cent. NBA: 58 to 60 per cent. NHL: 55 per cent. Premier League: 45 per cent home win rate, with another 25 per cent of games drawing, giving an effective home edge well above 50 per cent on a win-only basis.
Baseball sits at the bottom of the table. Why?
The first reason is the absence of referee influence. Baseball decisions are made by umpires whose calls – balls and strikes – are now monitored extremely closely. Home plate umpire bias, to the extent it ever existed in measurable form, has been compressed by automated tracking systems. In basketball and football, refereeing decisions have demonstrable home-team skews under crowd pressure. In baseball, the impact is much smaller.
The second reason is travel. Baseball teams play 162 games over six months, often with back-to-back-to-back road series. The away team is rarely fresher than the home team, but they are also not as severely jet-lagged or compressed as travelling teams in other sports. The travel structure of MLB tends to flatten the home advantage.
The third reason, and the one most underappreciated, is that the home team in baseball does not get to choose their pitchers based on home advantage. Starting pitcher rotations are set well in advance and are not adjustable for venue. In other sports the home coach can adjust tactics in real time based on crowd dynamics; in baseball the matchup is largely fixed before the game starts.
BetMGM’s Halvor Egeland captured something similar around the 2025 World Series Game 7, noting how the early money in big games reads operator-side – the Jays had closed the gap meaningfully as the series progressed, with decent interest building on them and early money landing on the home side for the deciding game. The point is that home advantage in baseball is partly a function of who is betting, not just who is playing, and the market reflects both in roughly the right proportions.
Batting Last: The Real Mechanical Advantage
Inside the broader 54 per cent figure sits one genuine mechanical advantage that matters more than crowd noise or familiarity: batting last.
The home team always bats in the bottom of every inning, which means they always have the last opportunity to score. In a tied game in the ninth, the home team bats with full knowledge of what the away team did or did not score in the top half. The away team never has that information – they bat in the top of every inning before knowing the home team’s response.
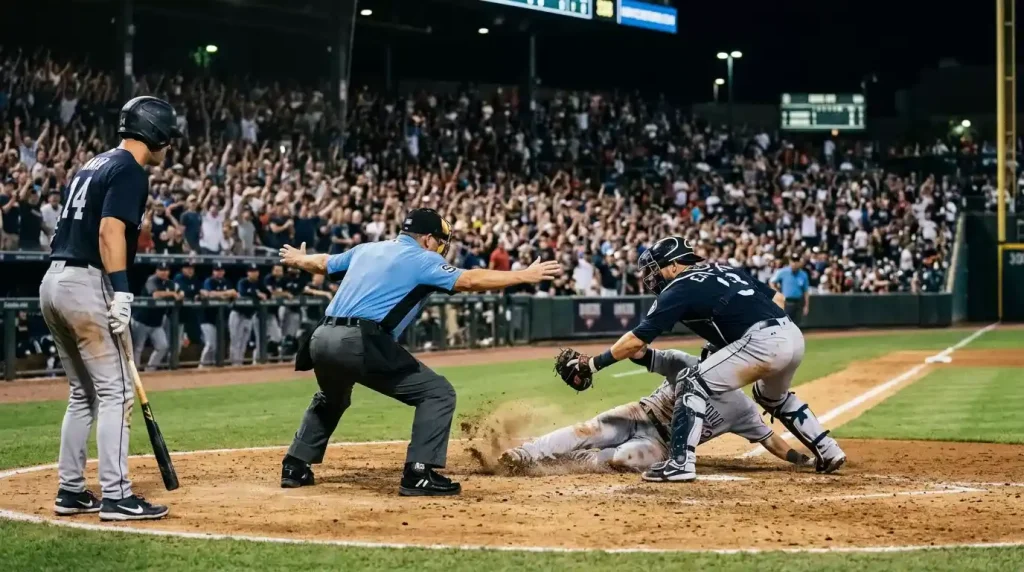
The asymmetry is most powerful in late innings of close games. A walk-off win – where the home team scores the winning run in the bottom of the ninth or later – accounts for roughly six per cent of all MLB games. That six per cent is essentially impossible for the away team by definition; only the home team can have a walk-off win. So the home edge in MLB is concentrated heavily in the last-inning scenarios where the home team has the structural advantage of the last bat.
This is why the home edge does not disappear on the run line. If you adjust for the score after eight innings – and many models have – the home team and away team are roughly even from there. The home edge mostly lives in the ninth and extras. That structural concentration is also why backing home teams as run-line favourites does not perform much better than backing them as moneyline favourites: the run-line decision is usually made before the walk-off opportunity arrives.
The implication for live betting is significant. The home team’s in-game moneyline price often appears too short in late innings precisely because the market correctly accounts for the structural advantage of last-bat opportunities. Sharp in-play bettors lay home teams in tight games rather than backing them – because the price has already absorbed the walk-off possibility.
What That 54 Per Cent Means at the Window
Knowing the home win rate is the foundation. Using it at the betting window is the application.
If you are evaluating a matchup and trying to price it yourself, start with the home edge as a baseline. An otherwise even matchup should price the home team somewhere around decimal 1.85 – implied probability 54 per cent. From there, adjust for pitching matchup, recent form, bullpen status, and other factors. The home edge is one variable among many, not the dominant one.
If you find a matchup where the home team is priced at 2.00 or longer despite no obvious pitching disadvantage, you may have found value. Conversely, if the home team is priced at 1.50 in a balanced matchup, you are paying a premium that goes beyond the 54 per cent baseline – the book is pricing additional information you may or may not have access to.
The other practical application is in run line markets. Home favourites at -1.5 carry a different risk profile than away favourites at -1.5. The home team has the walk-off advantage but rarely needs to extend their lead late in a close game – they win the moment they go ahead in the ninth. The away favourite covers the run line only by scoring after the eighth, which is structurally harder. Books price this differently. The article on MLB moneyline betting covers the broader question of how favourite-underdog dynamics interact with home and road status.
Home Edge Questions
The two questions that come up most about MLB home advantage are about whether it has shrunk over time and about how much weight it should carry when you size up a matchup. Both have direct answers grounded in the long-term data.
Is MLB home field advantage smaller than it used to be?
Slightly, yes. In the 1950s and 1960s the home win rate sat closer to 55 per cent, with some seasons creeping towards 56. The modern figure has settled around 54 per cent and dipped below 53 in 2018 and 2019. The compression has been gradual rather than sharp, and it tracks broadly with the reduction in umpire bias due to monitoring technology and with the general professionalisation of road accommodations and travel infrastructure for MLB teams.
How much should home advantage move a moneyline?
Roughly four to five percentage points of implied probability on an otherwise balanced matchup. That translates to a decimal price difference of about 0.15 to 0.20 between the home and away versions of an even matchup. On heavily lopsided matchups the absolute impact is smaller because the pitching and team quality differential dominates. Home edge is real but it is one input among many, not the headline factor.
This material was created by the Mound & Margin team.
Related posts

Park Factor in MLB Betting: How Ballparks Reshape Markets
One-Run Games and MLB Betting Math